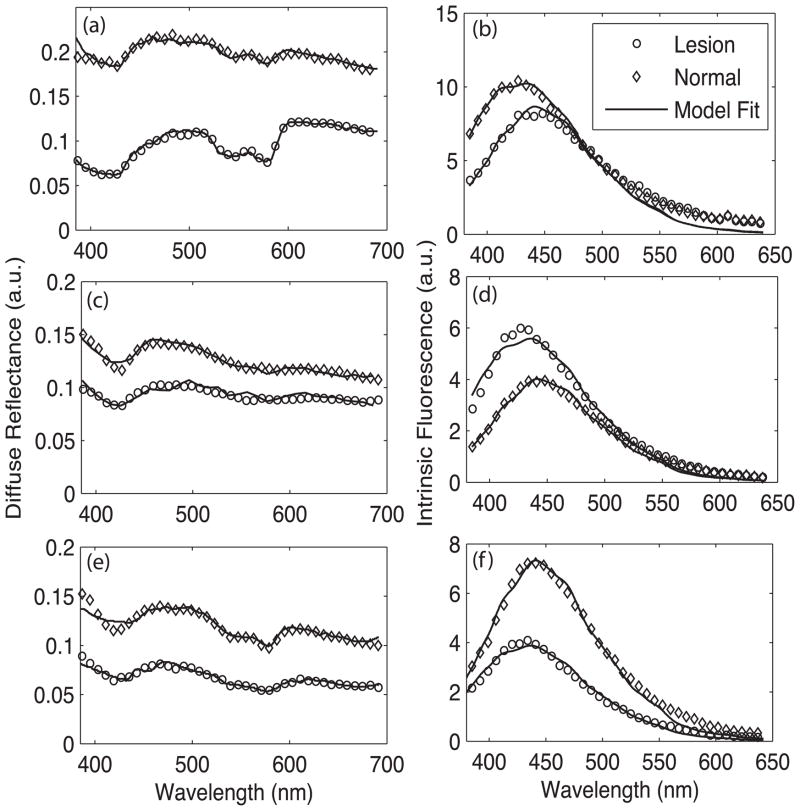
Figure 2.
Representative in vivo diffuse reflectance spectra (circles) from (a) malignant BCC, (c) pre-cancerous AK and (e) malignant SCC. The thin lines indicate LUT model fit. Also shown are the normal skin site measurements (diamonds). The corresponding intrinsic fluorescence spectra from 337 nm excitation for each cancerous group are shown in panels (b), (d) and (f).

