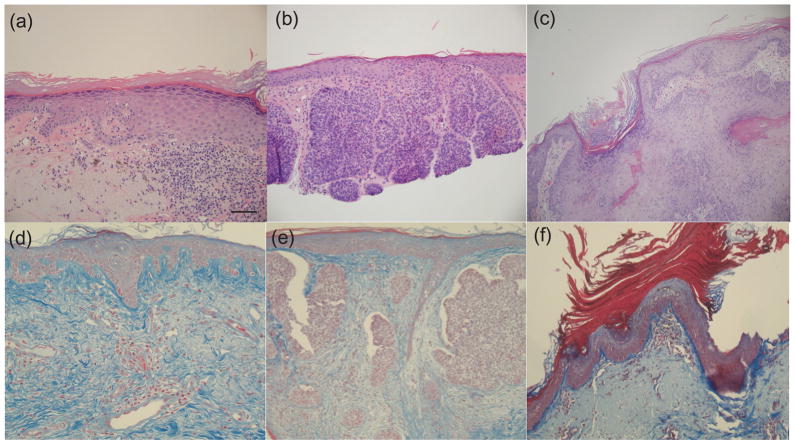
Figure 6.
Micrographs showing hematoxylin and eosin-stained sections (100x) from (a) AK (b) BCC and (c) SCC. The bottom row shows images of trichrome-stained sections of (d) normal skin (20x), (e) BCC (10x) and (f) AK (10x); collagen shows up as a blue color. Note abundant collagen in the normal skin image.

