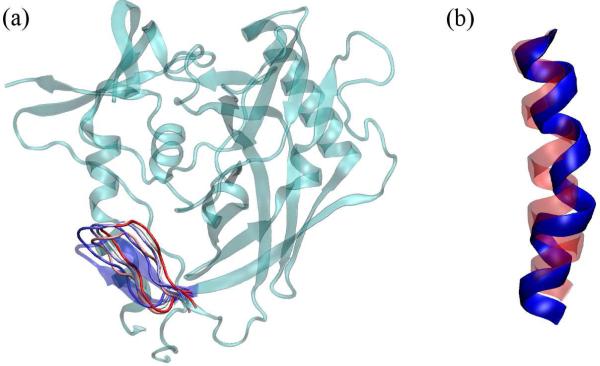
FIG. 10.
(a) Schematic representation of how β20/β21 was moved when it was pushed away from the hydrophobic core in DS1. Representative frames with a sampling rate of 1 frame per 0.5 ns are shown in tube rendering with the starting state in red and the final state in blue (only the β20/β21 region is depicted, the coordinates of the rest of the molecule are from the starting frame). β20/β21 from the crystal structure is shown in blue cartoon rendering. (a) α1 helix conformation during the TMD run with red showing the domain in the beginning and blue in the end of the simulation. At least 5 hydrogen bonds are destroyed.

