Figure 3.
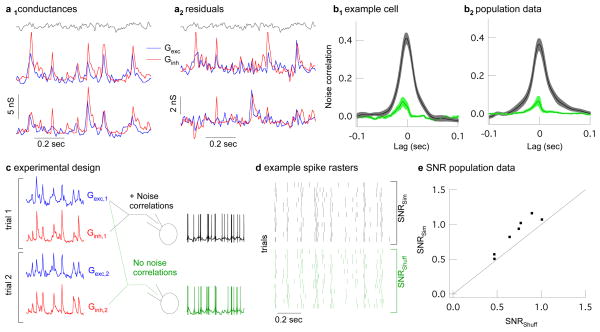
Strength and impact of noise correlations in synaptic inputs to primate midget ganglion cells. a1, Two trials of simultaneously recorded conductances during modulated light (gray). a2, Residual conductances (trials from a1 with mean subtracted), which estimate noise on each trial. b1, Cross correlation (mean ± sem, 12 trials) of excitatory and inhibitory residual conductances in an example cell during simultaneous (black) and non-simultaneous recording (green). b2, Cross correlation for all recorded cells (mean ± sem., 15 cells). c, Logic of dynamic clamp experiments using simultaneously or shuffled simultaneous conductances in place of synaptic input. d, Example spike trains from 12 dynamic-clamp trials of simultaneous conductances (black) or their shuffled counterparts (green). e, Signal-to-noise ratio of spike trains generated from simultaneous vs. shuffled conductances (dots). SNR for simultaneous conductances was 1.22±0.04 times higher than that for shuffled conductances (p = 0.0015, 7 cells).

