Figure 2.
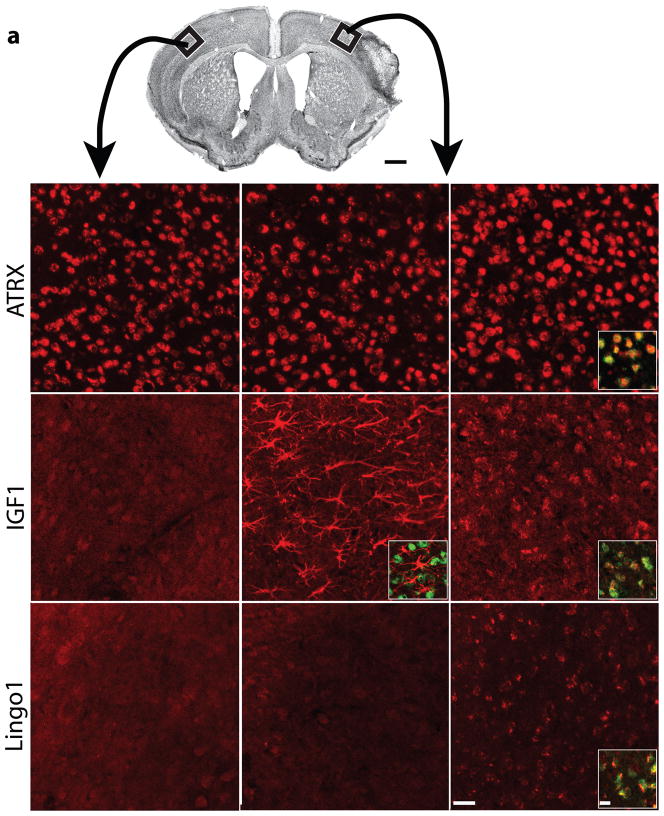
Cellular pattern of ATRX, IGF1 and Lingo1 expression in the brain after stroke. (a) Nissl-stained photomicrograph of mouse barrel field stroke model. Boxes indicate region of contralateral cortex (left column) and peri-infarct cortex in young adult (middle column) and aged adult (right column). (b–j) Panels for ATRX (b–d), IGF1 (e–g) and Lingo1 (h–j) show immunoreactivity in each condition. Insets: Colocalized staining of ATRX (red) and NeuN (green) is seen as yellow (d). IGF1 staining (red) localizes to astrocytes and not neurons (green) in young adult peri-infarct cortex (f). In aged adult peri-infarct cortex, IGF1 (red) co-localizes to NeuN positive neurons (green) (g). Lingo1 staining (red) localizes to NeuN positive neurons (green) in aged peri-infarct cortex (j). Scale bars, 1 mm (a), 50 μm (b–d) and 20 μm (insets).

