
Figure 5.
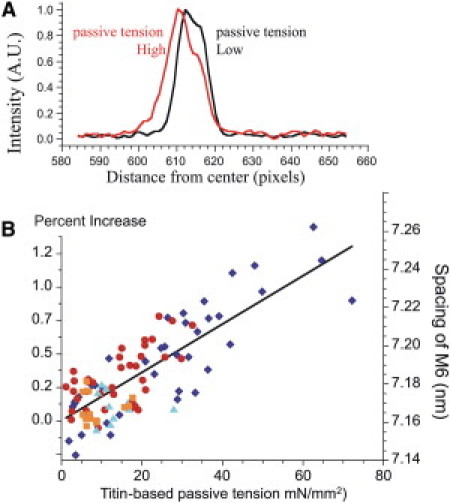
M6 spacing as a function of titin-based passive tension. (A) Examples of M6 intensity profiles from the same muscle at HPT and LPT (28 and 0 mN/mm2, respectively). Note that the profile at HPT is left-shifted (indicating an increase in M6 spacing). (B) Spacing data collected at peak passive tension (dark blue) and after 20 min of stress-relaxation (red) have the same relationship to passive tension. This relationship is not affected by the presence of 1.5% dextran (light blue, peak tension; orange, after 20 min of stress-relaxation). We conclude that thick filaments stretch elastically with increases in passive tension.