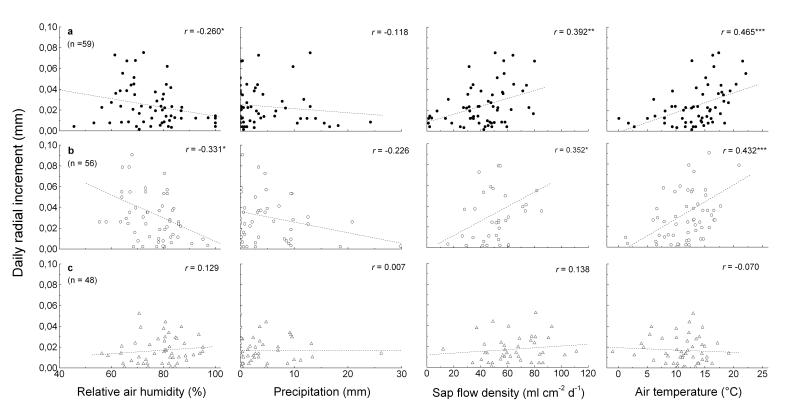
Figure 5.
Pearson correlations between daily radial increment and climate parameters (relative air humidity, precipitation, mean air temperature) and xylem sap flow density during May and June at the timberline (a, filled circles), treeline (b, open circles) and krummholz-site (c, open triangles). Due to incomplete sap flow records at the treeline and krummholz-site, number of samples used in calculations was 36 and 40, respectively. *** p < 0.001; ** p < 0.01; * p < 0.05.

