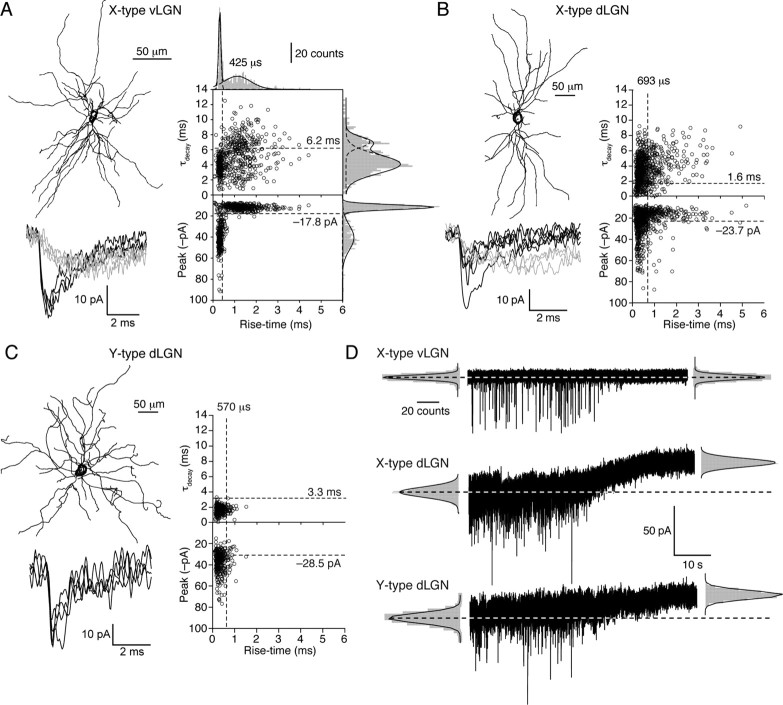
Figure 1.
Comparison of sIPSCs recorded from X- and Y-type relay neurons at physiological temperature. A, Coronal view of a reconstructed thalamic relay neuron with X-like morphology recorded from the vLGN. Note the clear polar distribution of dendrites (see also supplemental Fig. 1, available at www.jneurosci.org as supplemental material). Below are representative fast-rising, fast-decaying sIPSCs (black) and slower-rising and -decaying sIPSCs (gray) recorded from this cell (−60 mV). Plots of 10–90% rise-time against τdecay and peak amplitude for all sIPSCs recorded from this cell are shown on the right. The dashed lines denote the cutoff values for event grouping that were determined from the histograms of rise-time, τdecay, and peak amplitude (see Materials and Methods) (note, in B and C, the histograms themselves are omitted for clarity). The slow-rising and -decaying sIPSCs are represented in the upper right-hand quadrant. From comparison with the peak versus rise-time plot beneath, it is clear that these slow-sIPSCs tended to be small in amplitude. On average, the slow-sIPSCs in this cell had a mean 10–90% rise-time of 1.12 ± 0.06 ms and a τdecay of 7.01 ± 0.13 ms. Corresponding values for the fast-sIPSCs were 0.305 ± 0.002 ms and 4.06 ± 0.08 ms. B, Corresponding reconstruction and sIPSC analysis from a representative thalamic relay neuron with X-like morphology recorded from the dLGN, also showing both fast- and slow-sIPSCs. On average, the slow-sIPSCs in this cell had a mean 10–90% rise-time of 0.9 ± 0.1 ms and a τdecay of 3.89 ± 1.55 ms. Corresponding values for the fast-sIPSCs were 0.25 ± 0.001 ms and 1.68 ± 1.09 ms. C, Coronal view of a reconstructed thalamic relay neuron with clear Y-like morphology recorded from the dLGN; in this example, the dendrites emerge from the central soma with a radial distribution (see also supplemental Fig. 1, available at www.jneurosci.org as supplemental material). In this cell, all sIPSCs were fast-rising and -decaying (mean 10–90% rise-time of 0.213 ± 0.002 ms and a τdecay of 1.98 ± 0.04 ms). D, Continuous current recordings (−60 mV) from a representative X-type vLGN neuron and X- and Y-type dLGN neurons, showing the effects of 100 μm SR-95531. Current levels before and after antagonist application were determined from Gaussian fits to all-point histograms (gray). Dashed lines indicate the control current levels. In the vLGN cell, block of GABAARs resulted in loss of all sIPSCs, with no change in the holding current, indicating the absence of a GABA-mediated tonic conductance. By contrast, clear GABAAR-mediated tonic currents were seen in both neurons of the dLGN.

