
Figure 4.
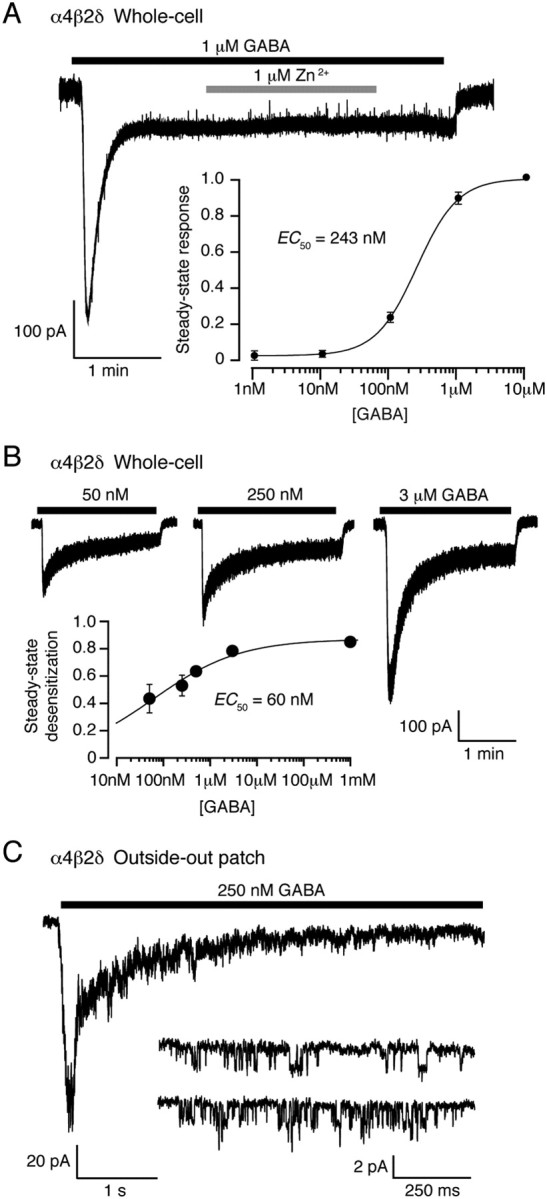
Steady-state desensitization of α4β2δ GABAARs at physiological temperature. A, Whole-cell record from a tsA201 cell expressing α4β2δ GABAARs (−30 mV, 37°C) during bath application of 1 μm GABA. Note the rapid desensitization to a steady-state response. Application of 1 μm Zn2+, which at low concentrations blocks αβ but not αβδ GABAARs (see Materials and Methods), did not affect the steady-state current, consistent with incorporation of the δ subunit into the GABAAR assembly. The inset shows the steady-state concentration–response curve. The solid line is a fit of the Hill equation, giving an EC50 of ∼250 nm. B, Whole-cell responses from a single tsA201 cell (−30 mV) in response to local GABA application. The peak and steady-state currents were used to construct the steady-state desensitization plot (inset). The solid line is a fit of the Hill equation, giving a desensitization EC50 of 60 nm. C, Current from an outside-out patch excised from a tsA201 cell expressing α4β2δ GABAARs (−30 mV) in response to application of 250 nm GABA. The inset shows single-channel openings recorded from the same patch, at steady state.