
Figure 3.
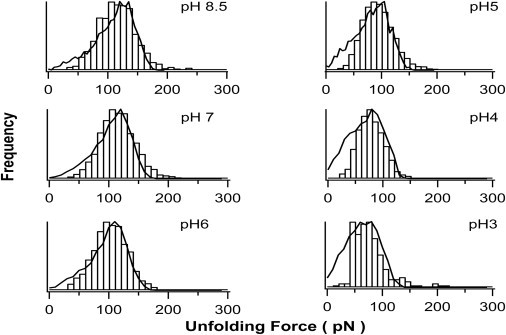
Histogram of the mechanical unfolding force for G6-53 at different pH. It is evident that the average unfolding force of G6-53 decreases on lowering the pH, whereas the width of the unfolding force distribution remained largely unchanged. The average unfolding forces of G6-53 are 115± 33 pN at pH 8.5 (n = 1328), 115 ± 33 pN at pH 7 (n = 2761), 101 ± 28 pN at pH 6 (n = 1036), 93 ± 30 pN at pH 5 (n = 2394), 78 ± 25 pN at pH 4 (n = 845) and 76 ± 32 pN at pH 3 (n = 197), respectively. Solid lines correspond to the unfolding force distribution generated using Monte Carlo simulations. In the Monte Carlo simulations, the same unfolding distance Δxu of 0.23 nm was used for all pH values. The following unfolding rate constant α0 values were found to be adequate to reproduce the unfolding force histograms obtained in AFM experiments: 0.10 s−1 for pH 8.5; 0.10 s−1 for pH 7; 0.12 s−1 for pH 6; 0.21 s−1 for pH 5; 0.38 s−1 for pH 4 and 0.45 s−1 for pH 3.