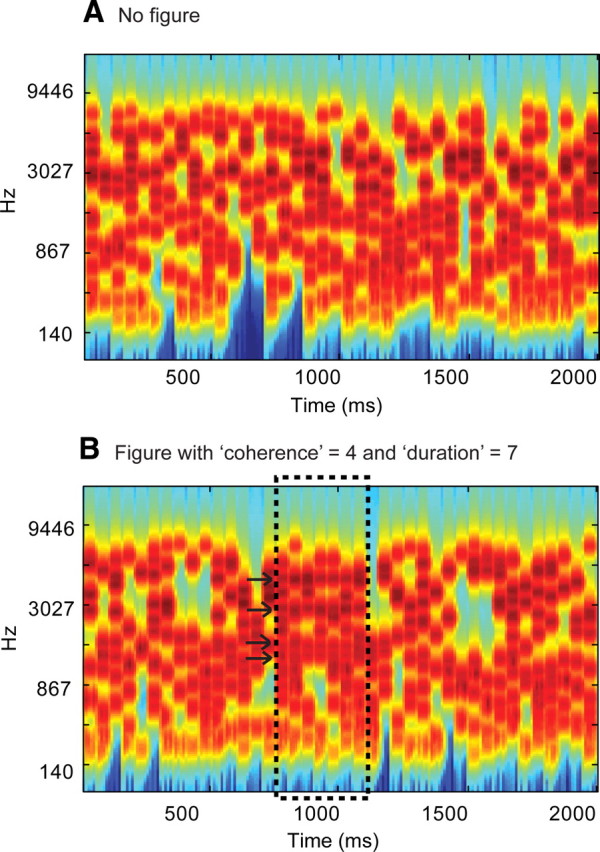
Figure 1.

Examples of the SFG stimuli used. A, Signals consisted of a sequence of 50-ms-long chords containing a random set of pure tone components. B, In 50% of the signals, a subset of tonal components repeated in frequency over several consecutive chords, resulting in the percept of a “figure” popping out of the random noise. The figure emerged between 15 and 20 chords (750–1000 ms) after onset. The number of repeated components (the “coherence” of the figure) and the number of consecutive chords over which they were repeated (the “duration” of the figure) were varied as parameters. The plots represent auditory spectrograms, generated with a filter bank of 1/ERB (equivalent rectangular bandwidth) wide channels (Moore and Glasberg, 1983) equally spaced on a scale of ERB-rate. Channels are smoothed to obtain a temporal resolution similar to the equivalent rectangular duration (Plack and Moore, 1990).
