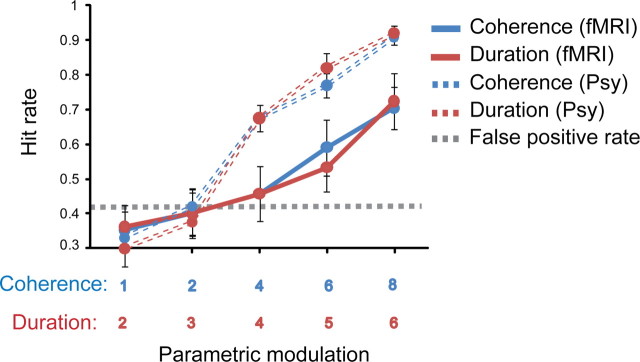
Figure 3.
Comparison of behavioral performance in the psychophysics and functional imaging experiments. Behavioral performance on the figure detection task obtained in the scanner with continuous image acquisition (solid lines) presented along with data from the same stimuli obtained in quiet (dashed lines; see psychophysical study, Fig. 2). Hit rate is shown as a function of fixed coherence (4 components) and increasing duration (in red) and as a function of fixed duration (4 chords) and increasing coherence (in blue). The dashed line represents the mean false-positive rate. Error bars represent SE.

