
Figure 5.
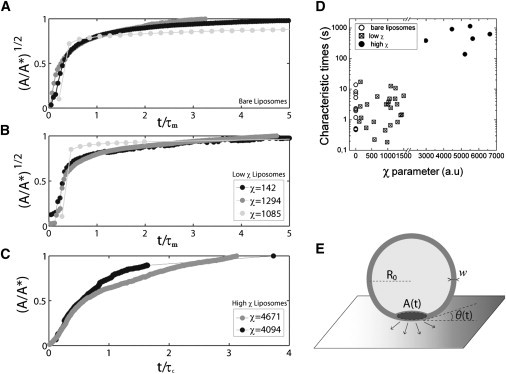
Spreading dynamics of liposomes with varying actin content. Spreading of (A) bare, (B) low χ, and (C) high χ liposomes on polyhistidine-coated coverslips. The contact area is normalized by the steady-state spread area A∗, and the time is normalized by the fitted time constant for each curve, τm for panels A and B, and τc for panel C. (D) Fitted time constants τm for bare liposomes (open circles) and liposomes displaying a low χ (squares), with τc for liposomes displaying a high χ (solid circles) as a function of the χ-value. Bare liposomes correspond to χ = 0. (E) Schematic representation of an adhered liposome during early spreading with notations.