FIGURE 4.

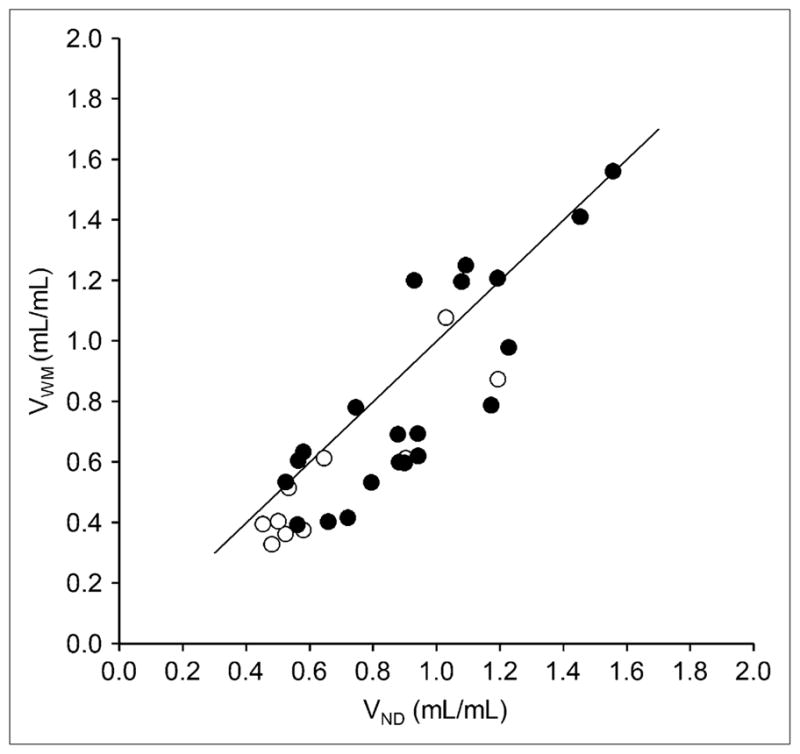
Correlation between 18F-FCWAY distribution volume in white matter (VWM) and in cerebellum (VND) in controls (○) and in TLE patients (●). For whole group, regression equation was VWM = −0.10 + 0.99 · VND (r2 = 0.76; P < 0.05).

Correlation between 18F-FCWAY distribution volume in white matter (VWM) and in cerebellum (VND) in controls (○) and in TLE patients (●). For whole group, regression equation was VWM = −0.10 + 0.99 · VND (r2 = 0.76; P < 0.05).