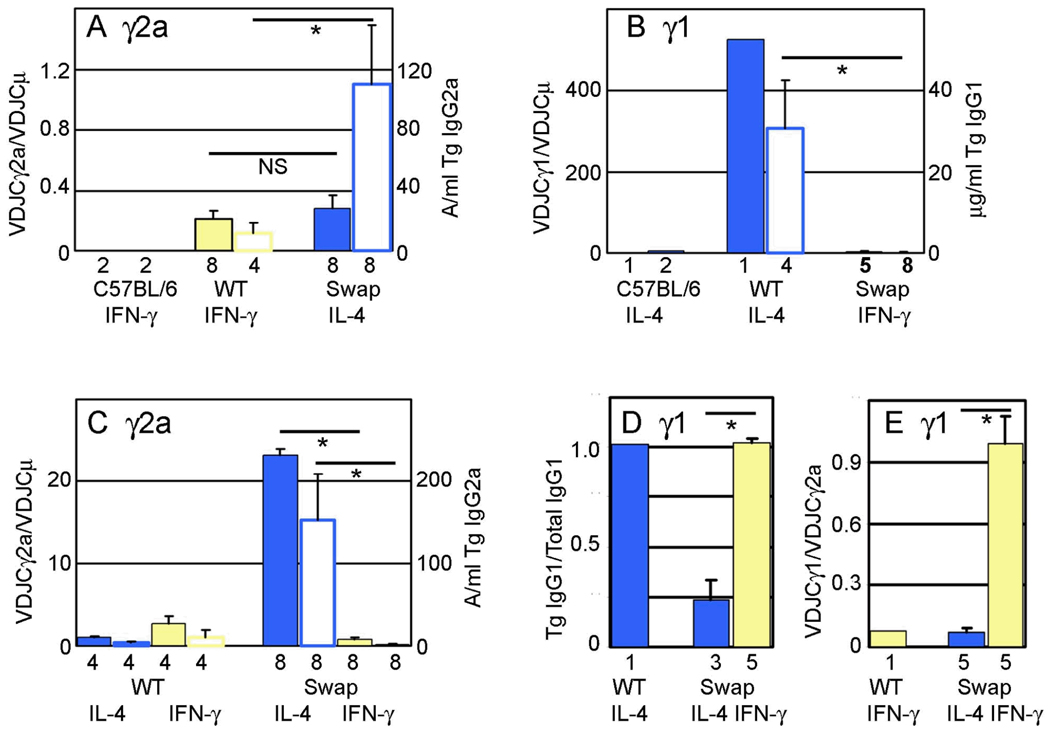
Figure 6.
Summary of heavy chain gene expression and regulation. In Parts A, B, and C, two bars are shown for each transgenic construct for a given cytokine treatment. The filled bar of each pair presents cDNA expression data (scale on the left y axis), and the open bar of each pair presents secreted Ig data (scale on the right y axis). The mean (with SEM bars if three or more samples were included) was determined by pooling data for all lines with the same transgenic construct from both LPS and CD40L cultures. The number of data points used is shown below each bar. Statistical significance is shown by a line above two bars and an asterisk (p<0.02, Mann-Whitney two-tailed test). A. Level of expression of the γ2a gene. Normalized γ2a expression was calculated as the density (from ImageQuant analysis) of the VDJCγ2a PCR fragment divided by the density of the VDJCμ fragment for individual cDNA samples (from Supplemental Fig. 4). Data was pooled from only those cultures with the appropriate cytokine added for maximal expression, as indicated below each pair of bars. The primary data for IgG2a secretion is found in Fig. 5. B. Level of expression of the γ1 gene, calculated as in Part A. The primary data is found in Figs. 4A and 5. C. Cytokine regulation of γ2a gene expression. IL-4 induction ratios were calculated as the VDJCγ2a band density/VDJCμ band density from cultures with activator+IL-4 divided by the VDJCγ2a band density/VDJCμ band density from cultures with LPS or CD40L only (primary data in Fig. 3). IFN-γ induction ratios were calculated similarly. IL-4 and IFN-γ induction ratios for secreted IgG2a were calculated by dividing the expression level in activator + cytokine by the expression level in activator only (primary data in Fig. 5). D. Cytokine regulation of γ1 gene expression. For various mice with the same transgenic construct the ratio of transgenic VDJCγ1 to total VDJCγ1 expression was calculated from fragment densities in Fig. 4B. Means were determined for a wild type transgene (with IL-4) and for transgenes with the promoter/I exon swap (both IL-4 and IFN-γ). E. IFN-γ induction of γ1 gene expression. For various mice with the same transgenic construct the ratio of transgenic VDJCγ1 to VDJCγ2a expression was calculated from fragment densities in Fig. 4C. Means were determined for a wild type transgene (with IFN-γ) and for transgenes with the promoter/I exon swap (both IL-4 and IFN-γ).

