Figure 3.
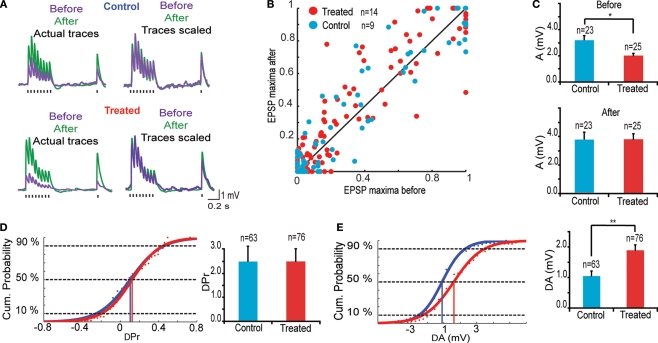
Changes in synaptic efficacy. (A) (Upper) Trains of EPSPs evoked by somatic current injection before and after 12 h of sodium glutamate perfusion of control population. (Lower) Trains of EPSPs evoked by somatic current injection before and after 12 h of glutamate perfusion of treated population. (B) EPSP maxima scattered around unitary line showing trend for voltage rescaling after glutamate perfusion. (C) Absolute values of synaptic efficacy (A), before and after network stimulation by sodium glutamate. (D) Cumulative probability histogram of ΔPr = Prafter − Prbefore. Highlighted points are those at 50% and correspond to the mean values for ΔPr. No significant difference in Pr between the two groups. (E) Cumulative probability histogram of ΔA = Aafter − Abefore. Highlighted points are those at 50% and correspond to the mean values for ΔA. Global increase in synaptic efficacy significantly higher for treated population.

