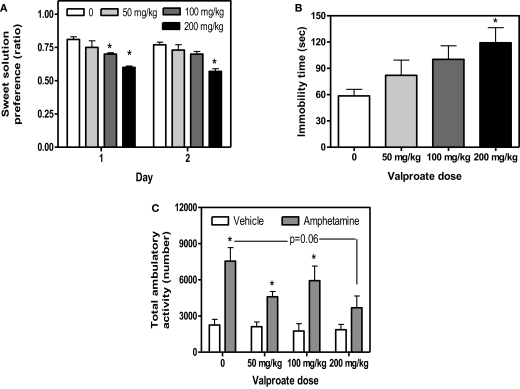
Figure 1.
Mean and standard error of (A) saccharin preference ratio on days 1 and 2 of the sweet solution preference test (B) immobility time (s) in the FST of BS mice treated with valproate and (C) total activity of BS mice treated with valproate and amphetamine. *Significantly different from the vehicle group (p < 0.05). N = 10/group for (A,B), N = 5/group for (C), except for the following: FST; 1 mouse from the 50 mg/kg and 1 mouse from the 100 mg/kg group, amphetamine-induced hyperactivity; 1 mouse from the 50 mg/kg + vehicle group and 1 mouse from the 200 mg/kg + amphetamine group were excluded from analysis due to automated system malfunctioning.

