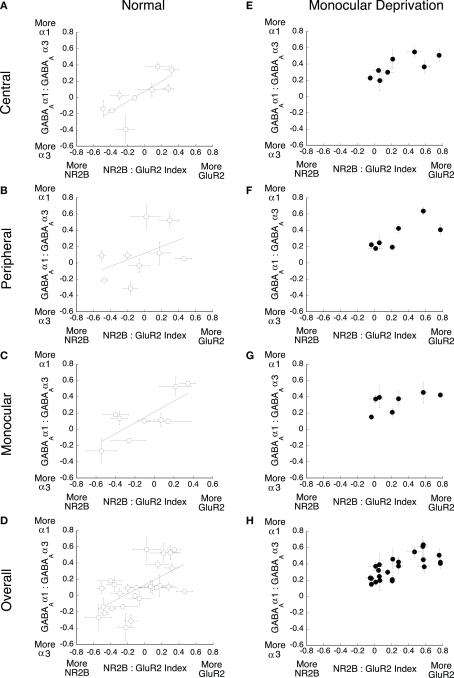
Figure 8.
Monocular deprivation disrupts the balance between NR2B:GluR2 and GABAAα1:GABAAα3. The relationship between these indices was plotted for (A–D) normal and (E–H) monocularly deprived animals. Significant correlations were found for normal animals (A) central (r = 0.75 p < 0.025), (B) peripheral (r = 0.65 p < 0.05) (C) monocular (r = 0.77 p < 0.01), and (D) overall (r = 0.62 p < 0.01), but no significant correlations were found for deprived animals.

