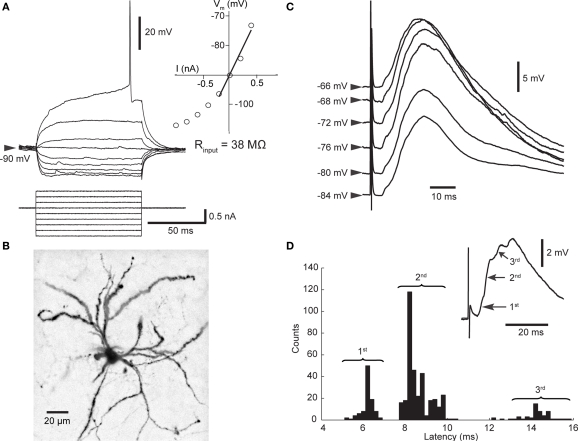
Figure 1.
Properties of SPNs and cortico-striatal PSPs. (A) Membrane potential response to linear current steps. The inset shows the current–voltage relationship; the input resistance was derived from the slope of the regression line. (B) Biocytin-filled SPN. The dendrites are densely studded with spines. (C) Dependence of PSP (mean of 5–63 trials) on membrane potential. All PSPs recorded over 15 min were sorted according to initial membrane potential and then averaged. Note the decreased amplitude when cortical stimulation was applied at depolarized membrane potentials. (D) PSPs consisted of several components. Distribution of latencies to maximum slope shows that latencies scattered around three distinct values representing PSP components as indicated in the mean PSP (inset).

