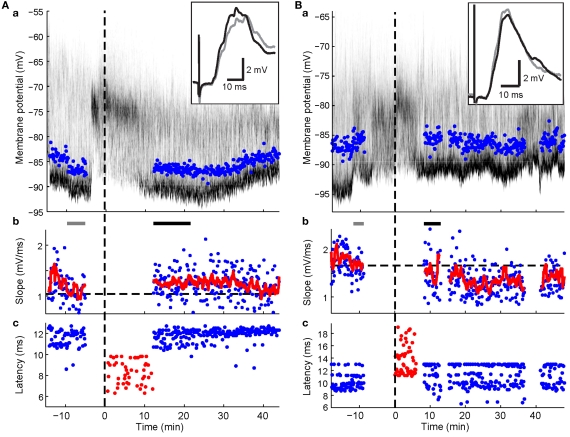
Figure 5.
Spike-timing-dependent increases and decreases in cortico-striatal synaptic efficacy. Format for panels a and b is the same as in Figure 3. Panels c, latencies of maximal slope measurements (blue dots) and spike times during the plasticity protocol (red dots). (A) Example recording showing potentiation (p < 0.001; Wilcoxon rank sum test) after pairing PSPs with a postsynaptic spike elicited by somatic current injection. Note spike latencies were relatively early compared to maximal slope latencies. (B) Example recording showing depression (p = 0.038; Wilcoxon rank sum test) after pairing with current-evoked spikes following the maximal PSP slope. Note the relative higher frequency of later latency components after the protocol.

