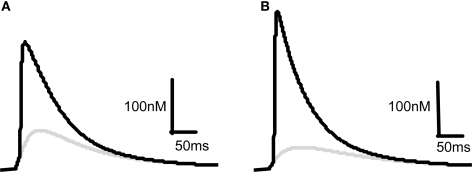
Figure 2.
Comparison of predicted [Ca2+] dynamics in dendritic spines and in the soma. [Ca2+] profiles in response to a 10 mV EPSP at the spine (A) or a 1 mV EPSP at the soma (B) on their own (gray) or in combination with a BPAP (black) of amplitude 60 mV at the spine (A) or 100 mV at the soma (B). The delay between EPSP and BPAP initiation is 10 ms.

