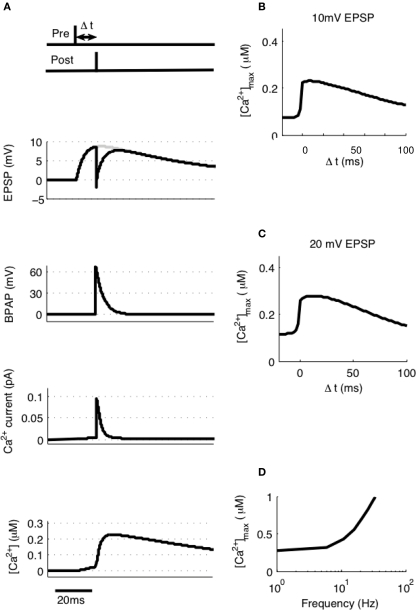
Figure 3.
[Ca2+] dynamics in response to paired pre- and post-synaptic spikes. (A) The model calculates [Ca2+] within a spine from the membrane potential resulting from a pair of pre- and post-synaptic spikes. Gray line shows EPSP in the absence of BPAP. Varying Δt shows that [Ca2+]max is greatest when 0 ≤ Δt ≤ 30 ms for 10 mV (B) or 20 mV (C) EPSPs. (D) The frequency of spike pairings given at Δt = 10 ms determines [Ca2+]max.

