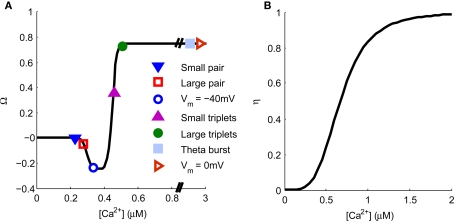
Figure 7.
Spine [Ca2+] determines the direction and magnitude of synaptic weight change. (A). The Ω−function describes the relationship between peak spine [Ca2+] and synaptic weight change. Symbols represent the peak [Ca2+] produced by a single application of the plasticity induction protocols shown in Figures 3–6 and indicate the resulting predicted synaptic weight change. (B) The η-function describes the learning rate for synaptic weight change as a function of peak spine [Ca2+].

