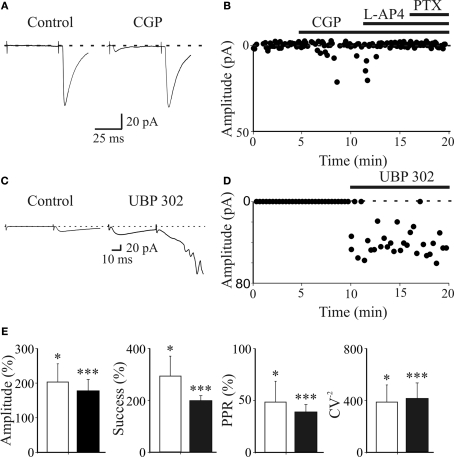
Figure 4.
Presynaptic GABAB and kainate receptors localized on MF terminals down regulate GABA release contributing to synapse silencing. (A) A “presynaptically” silent neuron before (left) and during bath application of CGP55845 (1 μM, right). Each trace is the average of 20 responses. Note the appearance of a synaptic current in the presence of CGP55845 (each trace is the average of 20 individual samples). (B) The peak amplitude of MF-GPSCs shown in A, before and during bath application of CGP55845, L-AP4 and PTX (closed bars) is plotted against time. (C,D) as in (A,B) but before and during bath application of UBP 302 (10 μM). Note that UBP 302 induced the appearance of the first response and enhanced the amplitude of the second one giving rise to an evoked GDP. (E) Each column in the graph represents the summary plot of peak amplitude, successes rate, PPR and inverse squared of CV of MF-GPSCs (expressed as percentage of controls) during CGP55845 (white columns; n = 10) or UBP 302 (black columns; n = 19). While amplitude and successes refer to both silent and non-silent neurons, PPR and CV−2 only to non-silent cells. *p < 0.05; **p < 0.01; ***p < 0.001. (A,B) modified from Safiulina and Cherubini, 2009.

