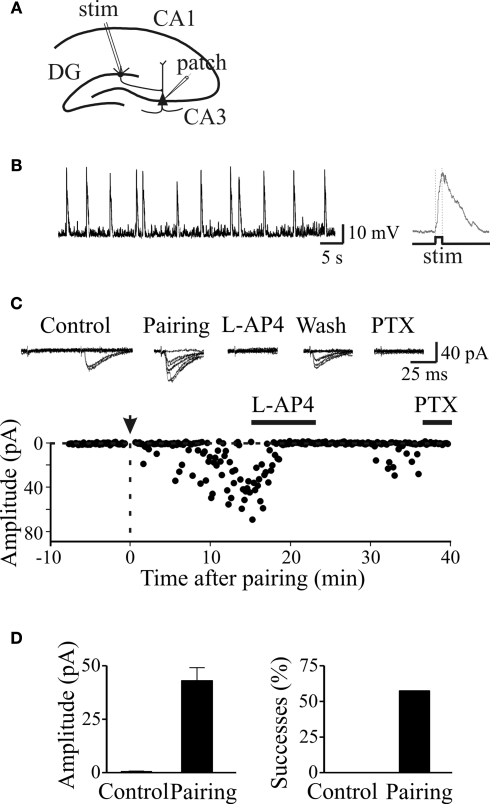
Figure 5.
Pairing switched on apparent “presynaptically” silent neurons. (A) Diagram of the hippocampus showing a CA3 pyramidal cell receiving a MF input. The stimulating electrode (stim) is in granule cell layer. (B) GDPs recorded from a CA3 pyramidal cell in current-clamp mode from the hippocampus at P2. On the right, a single GDP is shown on an expanded time scale (the intracellular solution contained QX 314 to block action potentials). The rising phase of GDPs (between the dotted lines) was used to trigger synaptic stimulation. (C) Peak amplitudes of MF-GPSCs before and after pairing (arrow at time 0) are plotted against time. The traces above the graph represent individual responses evoked in different experimental conditions. This synapse was considered “presynaptically” silent since it did not exhibit any response to the first stimulus over 48 trials (at 0.1 Hz) but occasional (two) responses to the second one. (D) Mean GPSCs amplitude and mean percentage of successes before (Control) and after pairing (n = 5). Modified from Kasyanov et al. (2004).

