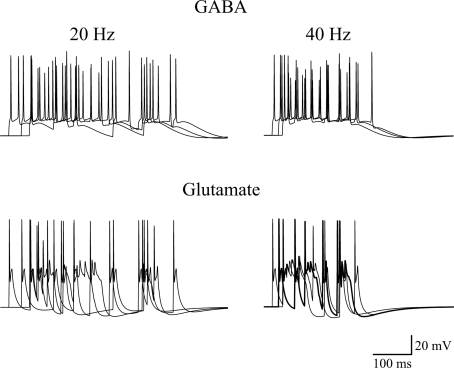
Figure 7.
Effects of GABAergic or glutamatergic synapses on a model neuron. Typical traces of somatic membrane potential are plotted during three simulations activating 30 synaptic inputs at an average frequency of 20 Hz (left) or 40 Hz (right), using GABAergic (top) or glutamatergic (bottom) synapses. The same stimulation pattern was used in both cases. The passive and active properties of the neuron were those used in a previous work, in a configuration that reproduced the experimental properties of CA3 cells showing firing adaptation (see Figure 9E in Hemond et al., 2008), adjusted to take into account the lower spike threshold (−45 mV) observed in early development in these neurons (Sivakumaran et al., 2009). The model files are available for download from the ModelDB section of the Senselab database (http://senselab.med.yale.edu).

