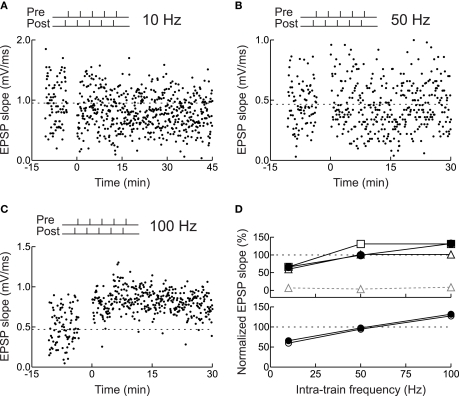
Figure 5.
Frequency dependence of STDP for layer 2/3 neurons in acute slices of young rat visual cortex. (A) Example of LTD induced by pairing pre- and postsynaptic spike bursts. Each burst consisted of five spikes with an intra-train frequency of 10 Hz (i.e., inter-spike interval of 100 ms). The postsynaptic train led the presynaptic train by 3 ms. (B) As in (A), but no synaptic modification was induced when the intra-train frequency was 50 Hz. (C) As in (A), but LTP was induced when the intra-train frequency was 100 Hz. (D) Actual and predicted synaptic modification after burst pairing. Filled symbols, experiments. Open symbols, model predictions: (top) gray triangles, multiplicative independent model without saturation; black triangles, multiplicative model with saturation; squares, additive model with saturation; (bottom) circles, additive suppression model with saturation. From Froemke et al. (2006).

