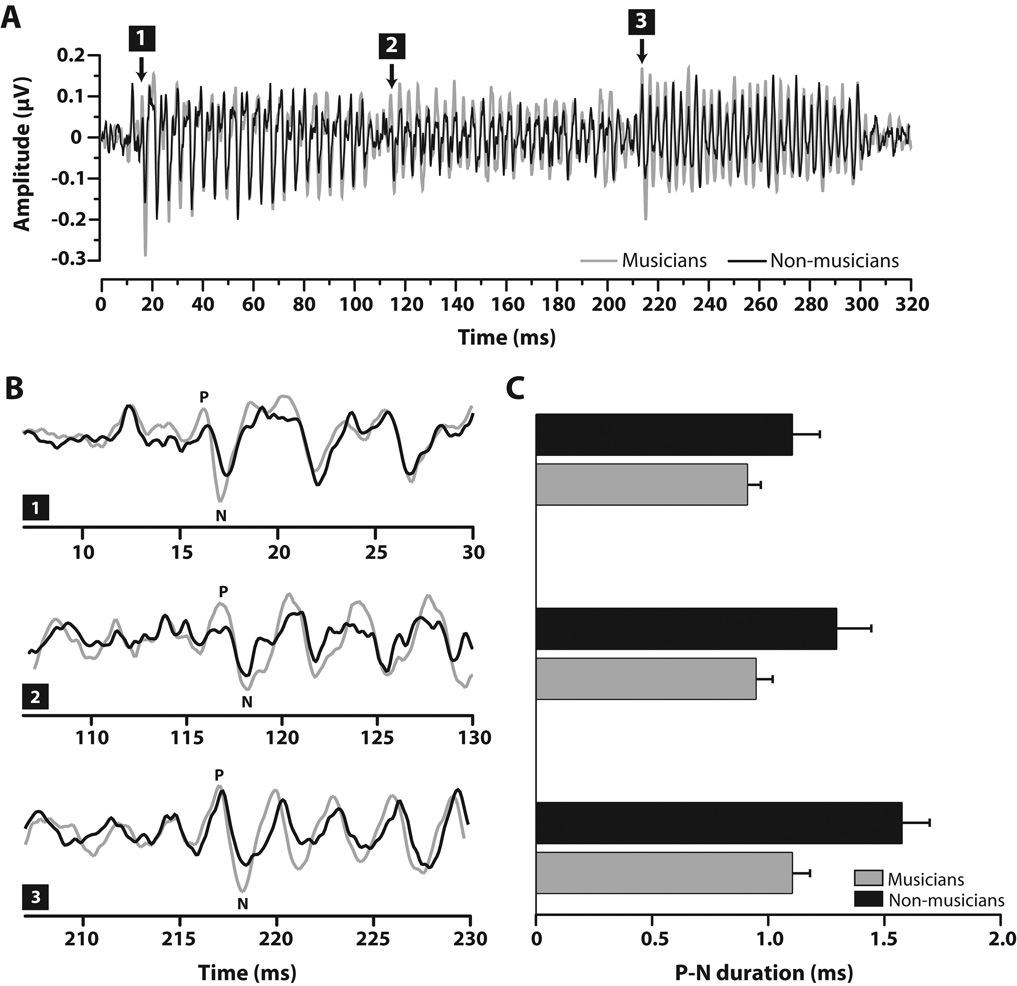
Figure 2.
FFR onset latencies to notes in the major chord stimulus. (A) Grand average FFR time-waveforms per group. Relative to non-musicians, musicians show larger amplitudes across the duration of their responses but most especially throughout the chordal third (i.e., 2nd note), the defining pitch of the sequence. Neural onsets to individual notes are demarcated by their respective number (1–3). (B) Expanded time windows around onset responses to individual notes (note 1 ≈17 ms, note 2 ≈ 117 ms, note 3 ≈ 217 ms). Relative to non-musicians, musicians generally show larger peak amplitudes in their positive-negative (P-N) onset complexes. (C). In addition, the smaller durations of musicians’ P-N complex across notes indicate their more precise, time-locked neural activity to each musical pitch. Error bars = 1 SE. FFR, frequency-following response.

