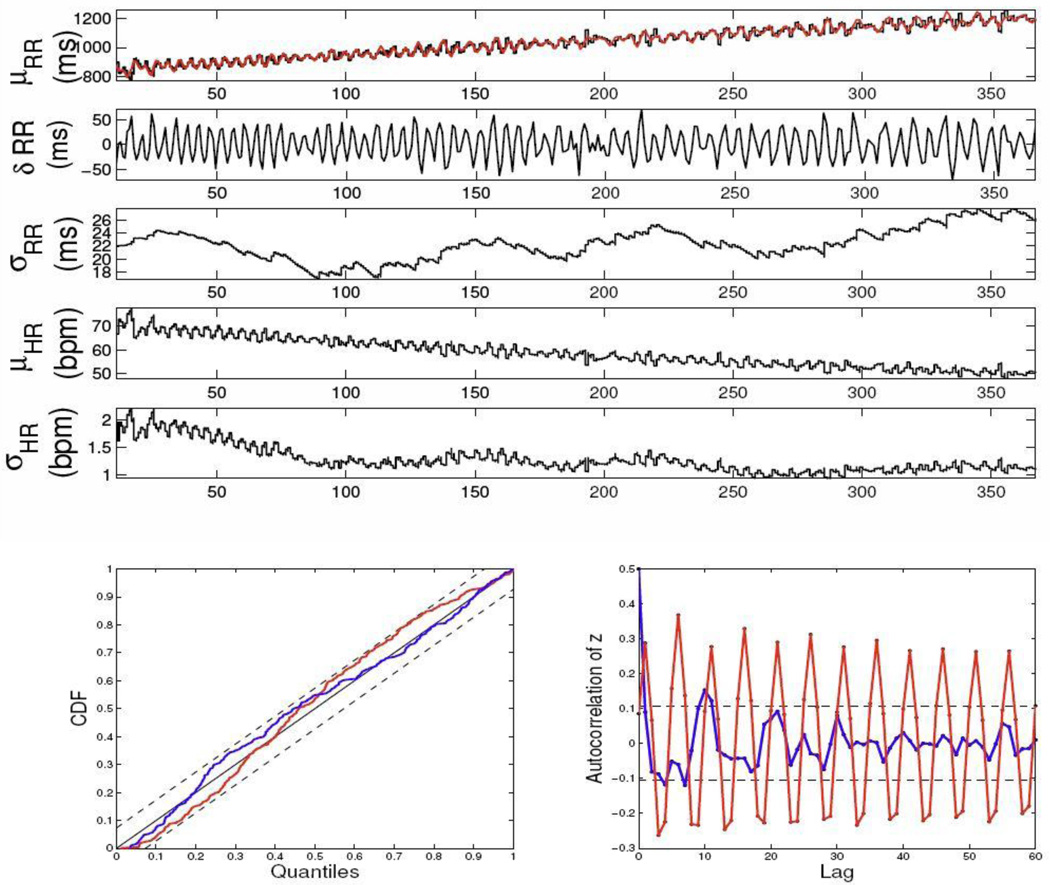
Figure 1.
Simulated R-R interval series (top panel, red trace) and the estimated instantaneous indices, as well as the KS plots and autocorrelation plots obtained from two models (Eqs. 3 and 4) for the instantaneous R-R mean. The KS statistic is improved from 0.072 (old model, red curve) to 0.059 (new model, blue curve).

