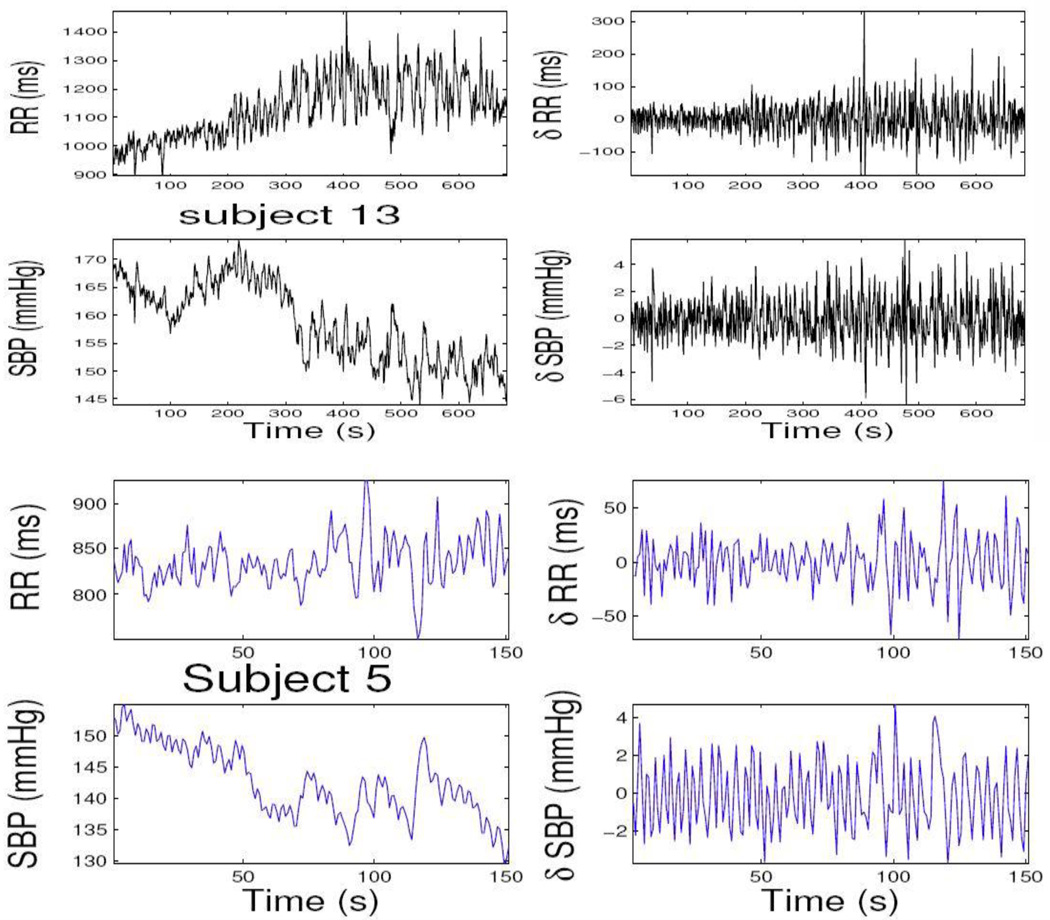
Figure 2.
Two experimental R-R interval series and SBP series (left panels) from two recording epochs during level-1 propofol concentration. Their corresponding incremental series are also shown at the right panels. In subject 13, R-R series has a clear increasing trend. In both subject 13 and subject 5, the SBP series has a clear decreasing trend.

