
Figure 1.
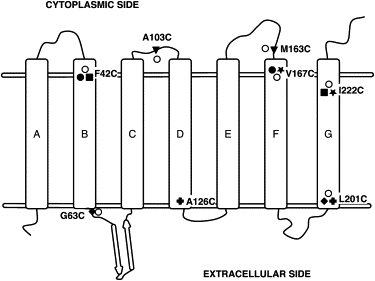
Topology diagram showing the locations of the designed cysteine mutations and labels in BR. The single mutants are shown as open circles and the double mutants are shown as shaded symbols. The residue locations for each pair of double mutants is represented with the same shaded symbol. The horizontal double lines approximate the membrane surfaces.