
Figure 2.
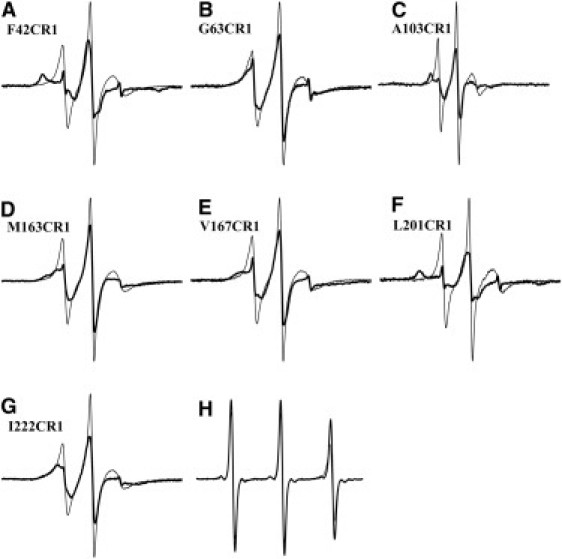
ESR spectrum of single-labeled denatured (thin lines) and regenerated (bold lines) states of F42CR1 (A), G63CR1 (B), A103CR1 (C), M163CR1 (D), V167CR1 (E), L201CR1 (F), and I222CR1 (G) BR samples, showing the difference in mobility of the spin label between the states. The spectra are normalized for equal numbers of spins in the D- and R-states. (H) Spectra of Cys+R1 in SDS micelles (thin line) and DMPC/CHAPS micelles (bold line).