
Figure 3.
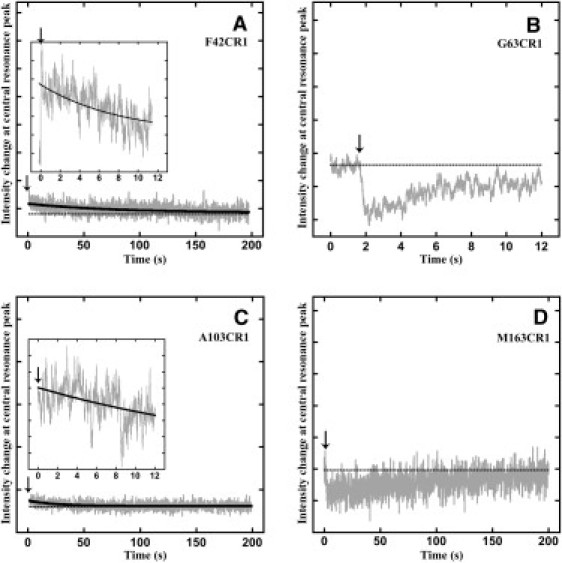
ESR mobility change kinetics measured at 3341 G for F42CR1 (A), G63CR1 (B), A103CR1 (C), and M163CR1 (D). The intensity change observed for F42CR1 and A103CR1 is ∼5% of the expected change (magnitudes shown in the insets). The dotted horizontal line in black represents the signal intensity at time zero of the measurement. The arrows point to the time of actuation of the stop-flow pump, which initiates mixing and thus refolding.