
Figure 4.
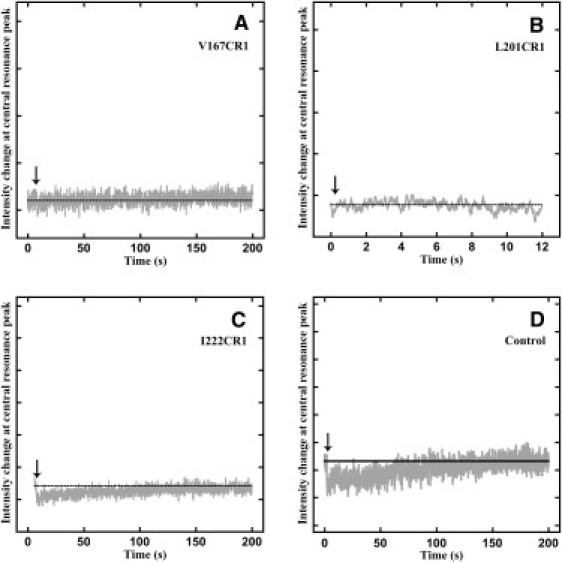
ESR mobility change kinetics measured at 3341 G for V167CR1 (A), L201CR1 (B), I222CR1 (C), and control with l-cysteine attached to MTSL spin label in regenerating buffer mixed with SDS micelles (D). The dotted horizontal line in black represents the signal intensity at time zero of the measurement. The arrows point to the time of actuation of the stop-flow pump, which initiates mixing and thus refolding.