
Figure 5.
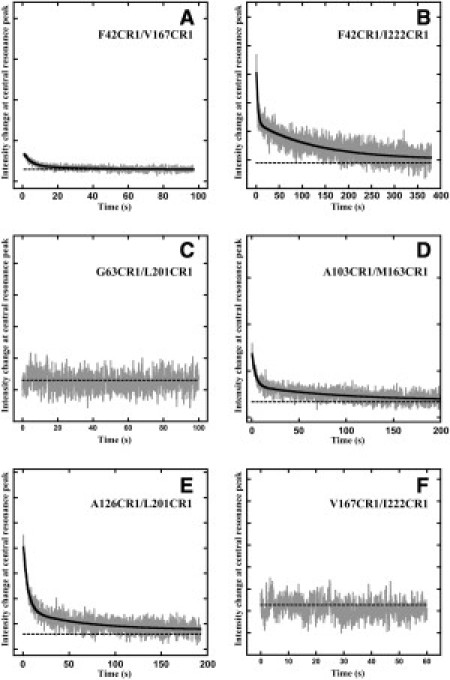
ESR dipolar interaction change kinetics measured at 3341 G for F42CR1/V167CR1 (A), F42CR1/I222CR1 (B), A103CR1/M163CR1 (C), V167CR1/I222CR1 (D), G63CR1/L201CR1 (E), and A126CR1/L201CR1 (F). The dotted horizontal line in black represents the signal intensity at time zero of the measurement.