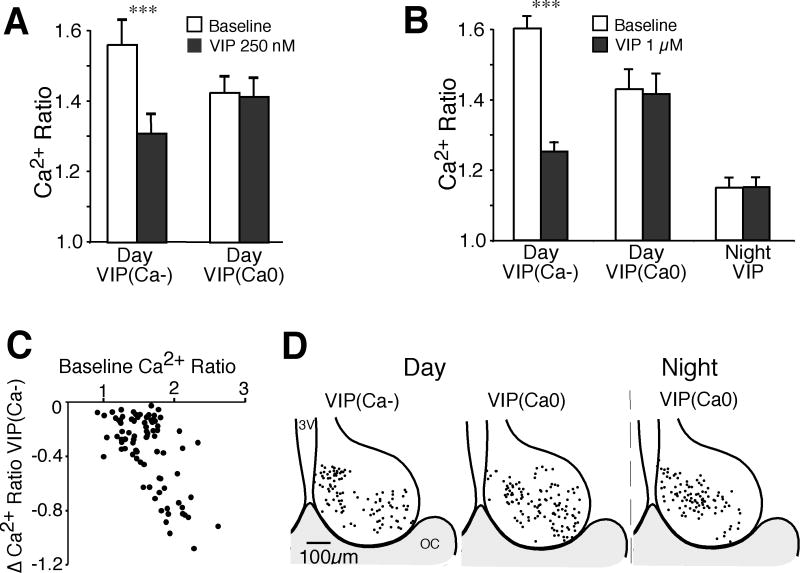
Figure 2. VIP induces a reduction of baseline [Ca2+]i during the day but not the night.
A. Comparison of the mean Ca2+ ratio of SCN neurons at baseline and following application of VIP (250 nM) during the day (n = 96). VIP (250 nM) induced a significant reduction from baseline in SCN neurons showing a VIP(Ca−) response (n = 26, t = 7.24, *** p < 0.0001), while most neurons had little or no response (VIP(Ca0), n = 61, t = 1.15, p = 0.25), and only 9 neurons had a Ca2+ increase (data not shown). B. Comparison of the mean Ca2+ ratio of SCN neurons at baseline and following application of VIP (1 μM) during the day (n = 152) and night (n = 121). During the day, VIP (1 μM significantly reduced the baseline Ca2+ ratio (mean ± SEM) in VIP(Ca−) neurons (n = 82, t = 11.9, *** p < 0.0001), but not in the VIP(Ca0) group (n = 59, t = 1.71, p = 0.093), while only 11 neurons showed a Ca2+ increase (data not shown). During the night, VIP reduced the Ca2+ ratio in 7% of neurons. The data shown is the mean ± SEM of all nighttime neurons (n = 121 neurons, t = 0.114, p = 0.91). Note the baseline Ca2+ ratios were higher during the day than the night, and that VIP reduced the Ca2+ ratios of VIP(Ca−) responding neurons to near nighttime levels. C. Plot of the baseline Ca2+ ratio versus the VIP (1 μM)-induced change in the Ca2+ ratio in VIP(Ca−) neurons during the day. Note that larger reductions in Ca2+ occur in neurons with higher baseline Ca2+ ratios (R2 = 0.41). D. Regional location of VIP-treated neurons during the day and night. The position for each VIP(Ca−) and VIP(Ca0) neuron was superimposed on a representative drawing of the SCN with the third ventricle (3V) on the left and optic chiasm (OC) at the bottom. Neither VIP(Ca−) or VIP(Ca0) neurons demonstrated a clear regional expression pattern.

