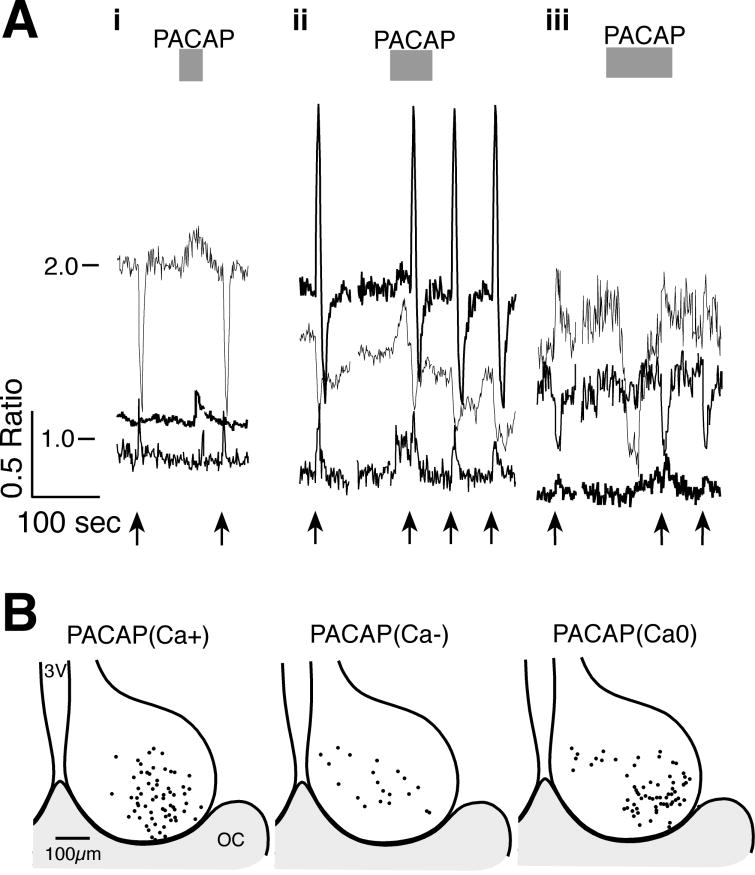
Figure 6. The Effects of PACAP on [Ca2+]i in SCN neurons.
A. Examples of the variety of Ca2+ responses observed with PACAP (1–38) application onto SCN neurons during the day. i & ii) PACAP (250 nM) evoked transient Ca2+ elevations without altering the RHT stimulation-induced transients (arrows, 100 pulses at 20 Hz). iii) PACAP (500 nM) evoked a Ca2+ reduction in one neuron and an elevation in another. B. Regional localization of SCN Ca2+ responses to PACAP. The position of each neuron where PACAP elevated [PACAP(Ca+)], reduced [PACAP(Ca−)] or produced no response [PACAP(Ca0)] was superimposed on a representative drawing of the SCN with the third ventricle (3V) on the left and optic chiasm (OC) at the bottom.

