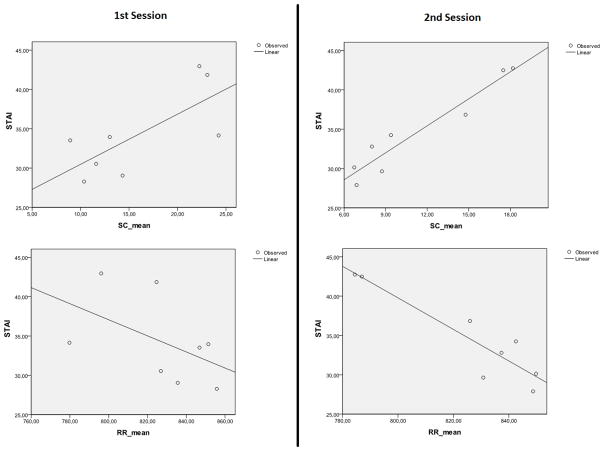
Figure 4.
Regression analysis on STAI/SC means (top) and STAI/RR means (bottom) for all epochs in (left) session 1 and (right) session 2. STAI/SC S1: Correlation=0,722; Sign at 0,05 (bilateral); R Square=0,521. STAI/SC S2: Correlation=0,959; Sign at 0,01 (bilateral); R Square=0,919. STAI/RR S1: Correlation=0,502; Not Sign; R Square=0,252. STAI/RR S2: Correlation=0,920; Sign at 0,01 (bilateral); R Square=0,847.

