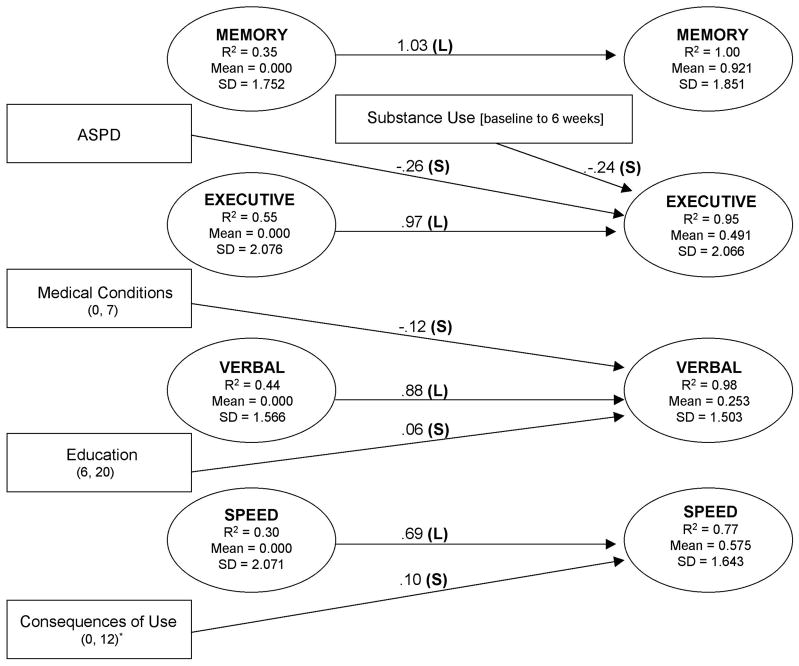
Figure 2.
Risk factor path model for latent factors at 6-week follow-up. The timeline of the measures proceeds from left to right: latent factors (ovals) and risk correlates (rectangles) assessed at treatment entry on the left, substance use between treatment entry and follow-up in the center, and latent factors identified at follow-up shown on the right. Only significant paths from risk factors to latent factors at follow-up are shown, with the unstandardized path coefficients on the arrows. For dichotomous variables, the unstandardized path coefficients represent the difference between the ability means of the two groups. For continuous variables, point ranges are shown in parentheses. The consequences of use scale was rescaled (divided by 3) to facilitate iterative estimation. R2 of the latent factors refers to the proportion of true variance in latent abilities accounted for by the risk covariates. Means and SDs of the latent factors are provided because the effect sizes of unstandardized path coefficients need to be interpreted with respect to the SDs of continuous variables. For the readers’ convenience, paths in which estimated ESs (unique proportion of variance explained) were <0.10 were coded as small (S), ES = 0.10 to 0.24 as medium (M), and ES = ≥0.25 as large (L) (Murphy and Myors, 2004).

