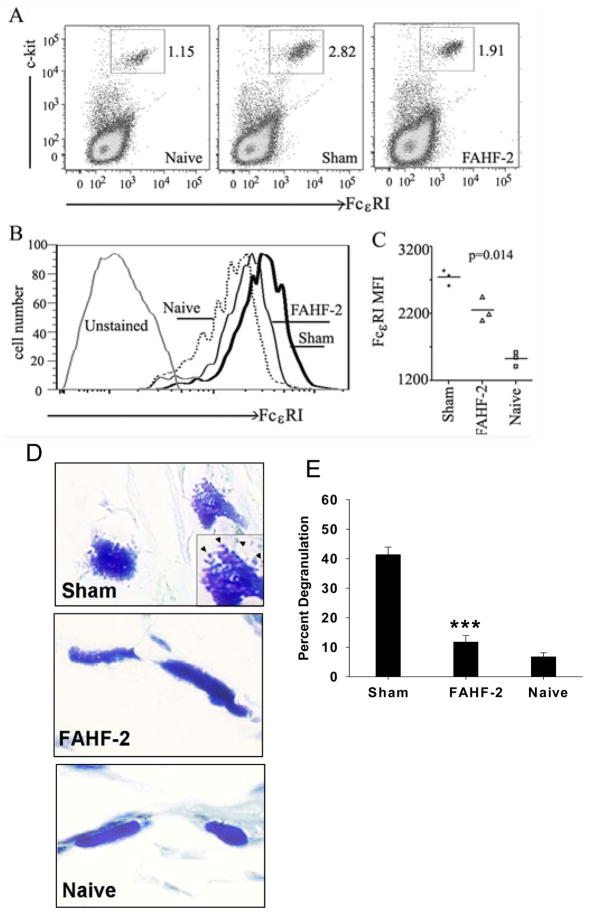
Figure 3. FAHF-2 reduced the number of and FcεRI expression of peritoneal cavity mast cells.
A. Data show one representative result with mast cells within the gated area. Numbers indicate percent. B. Mast cells (c-kit and FcεRI double-positive) were gated to show FcεRI levels in each group as indicated. C. FcεRI MFI. Each dot indicates one set of pooled cells from each group. Bars indicate the mean values of each group. D. Representative images of cutaneous mast cells in skin tissue of each group of mice. E. Percent of degranulated cutaneous mast cells in skin samples post challenge. Data is shown as Mean ± SEM (n=5). ***p<0.001 vs naïve.

