Figure 2.
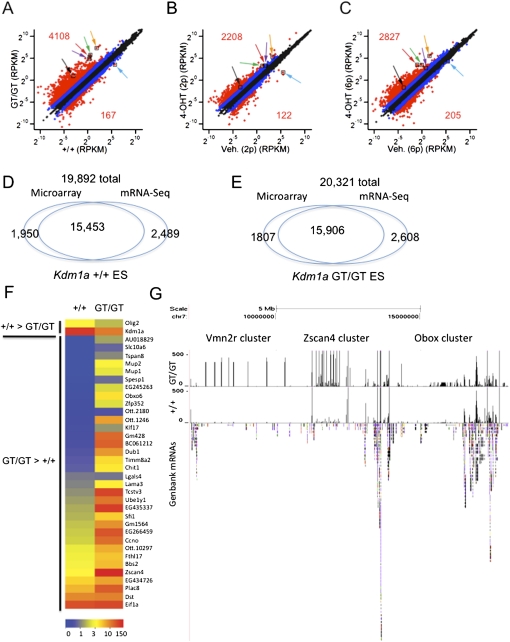
Gene expression profiling of Kdm1a mutant ES cells. (A–C) mRNA-seq was performed on polyA-enriched mRNAs from Kdm1a +/+ and GT/GT ES cells (A) or Kdm1a FL/FL Cre-ERT ES cells treated with vehicle or 4OHT and passaged two (B) or six (C) additional times. Each plot displays the expression value of UCSC known genes passing the minimal expression filter in wild-type (X-axis) and corresponding mutant ES (Y-axis) cells. Data points in red indicate a greater than fourfold difference in the mutants (numbers indicate the total number of genes with a greater than fourfold change), while those in blue indicate a greater than twofold difference. Colored arrows label the following genes: Tcstv1 (green), Tcstv3 (red), Zscan4d (orange), Zfp352 (black), Eif1a (purple), and Kdm1a (blue). (D,E) Comparison of the number of UCSC known transcripts detected by Affymetrix microarrays (using absent and present calls) or mRNA-seq (using a minimum threshold of RPKM > 1) in Kdm1a +/+ (D) or GT/GT (E) ES cells. (F) Expression levels of genes (in RPKM) in Kdm1a +/+ and GT/GT ES cells. Genes displayed were those identified as misexpressed by microarray analysis in Kdm1a mutant ES cells. (G) UCSC genome browser screenshot of mRNA-seq reads aligning to chromosome 7 in wild-type and Kdm1a GT/GT ES cells. GenBank mRNAs are displayed below to highlight gene density. Positions of gene clusters displaying increased expression in Kdm1a mutant cells are indicated. Reads aligning with the Vmn2r cluster do not align to any known or predicted genes and might correspond to regulatory RNAs.

