Figure 5.
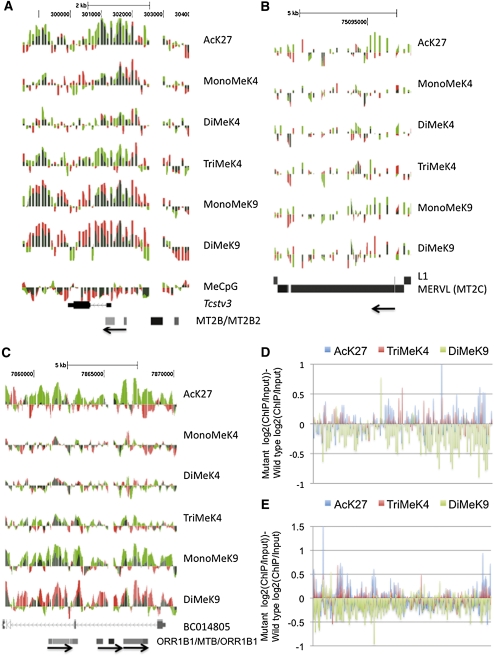
Kdm1a mutant ES cells display histone modifications associated with transcription activation at target genes. (A–C) ChIP-on-chip analysis was performed on Kdm1a +/+ or Kdm1a GT/GT ES cells with histone modification-specific antibodies or methylated CpG antibodies (shown on the right). The normalized log2 intensity ratios were displayed as individual tracks on the UCSC genome browser for Kdm1a +/+ (red) and Kdm1a GT/GT (green) ES cells, and the tracks were overlaid. Red and green overlapping tracks appear dark green. Tracks from the Tcstv3 gene (A), a MERVL retrovirus (B), and a cluster of ORR1B1 and MTB LTRs (C) are shown. The direction of the LTRs (5′–3′) is indicated with an arrow. (D,E) The normalized log2 ChIP/Input intensity values (for AcK27, TriMeK4, and DiMeK9) from Kdm1a +/+ ES cells were subtracted from the corresponding log2 ChIP/Input values from Kdm1a GT/GT ES cells. The subtracted values for 108 MERVL elements (D) and 307 ORR1B1 elements (E) tiled on chromosome 19 are displayed.

