Figure 4.
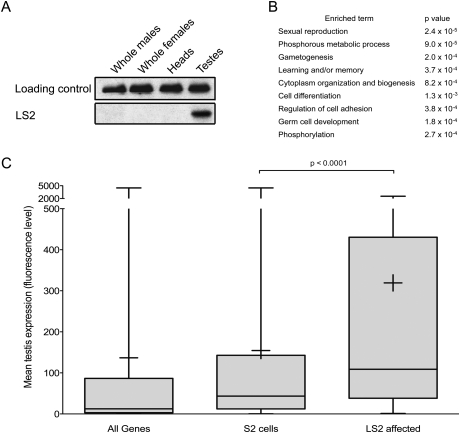
LS2 and its target transcripts are enriched in testes and regulate testes-related functions. (A) Immunoblot analysis of lysates from whole flies, heads, and testes probed with anti-PSI (loading control) and anti-LS2 antibodies. (B) Enriched GO terms for the LS2-affected genes (Al-Shahrour et al. 2006). P-values were calculated using a two-tailed Fisher's exact test. (C) Testes expression levels of all genes, genes expressed in S2 cells, and genes affected by LS2. The Y-axis is the mean expression level from four Affymetrix Dros2 expression arrays (Chintapalli et al. 2007). Whiskers represent the maximum and minimum values, boxes represent the 25th and 75th percentiles, crosses represent the mean value, and lines represent the median value. P-values were calculated using a two-tailed t-test.

