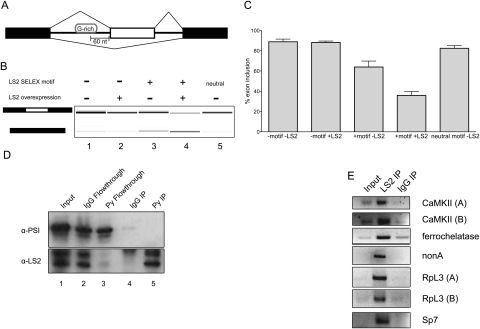
Figure 6.
LS2 acts as a splicing repressor in vivo, is enriched at specific positions in its target transcripts, and binds its predicted targets. (A) The minigene splicing reporter used with or without an LS2 G-rich binding motif inserted 60 nt upstream of the cassette exon (white). (B) Effect on exon inclusion in S2 cells as measured by RT–PCR of RNA expression from the minigenes carrying the LS2 recognition motif and LS2 overexpression. (Lane 1) Splicing pattern without LS2 motif or LS2 overexpression. (Lane 2) Splicing pattern without LS2 motif, but with LS2 overexpression. (Lane 3) Splicing pattern with LS2 motif, but without LS2 overexpression. (Lane 4) Splicing pattern with LS2 motif and LS2 overexpression. (Lane 5) Splicing pattern with neutral motif (see the Supplemental Material) and without LS2 overexpression. The left schematic denotes inclusion (top) or exclusion (bottom) product. (C) Quantification of results in B. Error bars represent standard deviations from three independent biological replicates. (D) Drosophila S2 cells stably expressing epitope-tagged (Glu–Glu, also called Py) LS2 protein were lysed and LS2 was immunoprecipitated using either anti-Py antibodies (lane 5) or nonimmune IgG (lane 4), and was detected using anti-PSI antibodies (top panel) or anti-LS2 antibodies (bottom panel). Input protein is shown in lane 1 (5% of input). PSI protein was detected and used as a negative control for immunoprecipitation. Both immunoprecipitation pellets and flowthrough material for IgG (lanes 2,4) or anti-Py antibody (lanes 3,5) are shown. (E) Immunoprecipitation of LS2 nuclear RNP complexes followed by RT–PCR of predicted affected transcripts using equal amounts of immunoprecipitated or input RNA. These included two CaMKII isoforms, ferrochelatase, nonA, two RpL3 isoforms, and Sp7. cDNA amplification products specific for each gene were compared between input RNA, LS2-immunopurified, and nonimmune IgG-immunopurified RNA samples.

