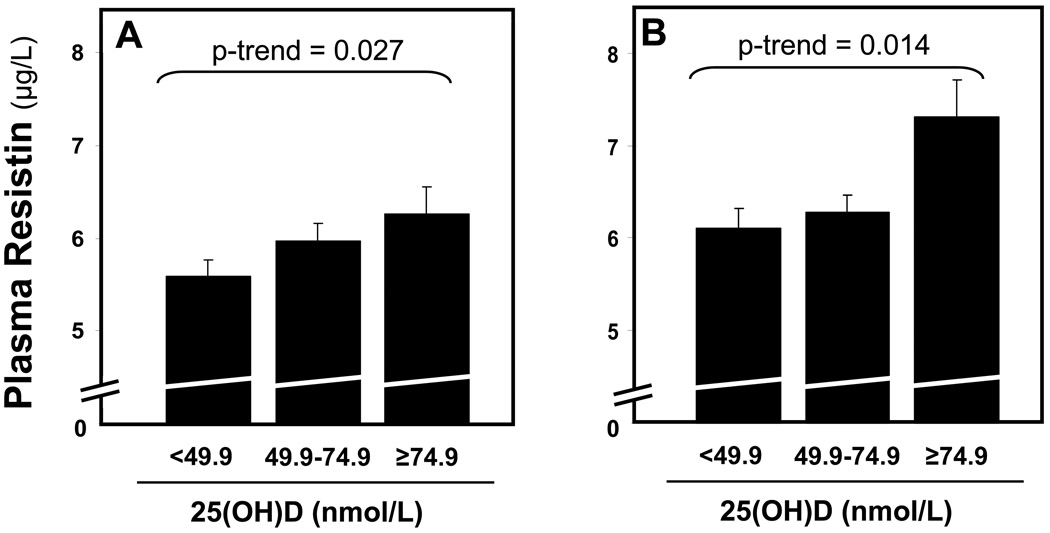
Figure 1. The relationship between 25(OH)D and plasma resistin concentrations in high-dietary sodium balance (A) and low-dietary sodium balance (B).
Bars represent the mean resistin concentration in each 25(OH)D category while whiskers represent the standard error of means. P-values represent the test statistic for multivarvariate linear regression trends.

