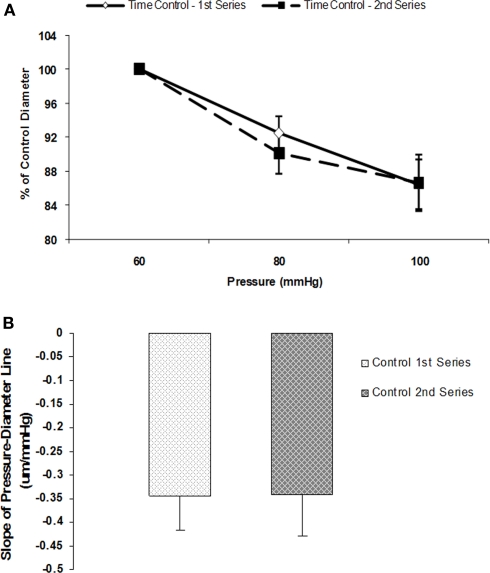
Figure 2.
Myogenic responsiveness exhibited in isolated cremaster arterioles. Slope of myogenic pressure–diameter relationship as determined by regression analyses used as an index of myogenic gain. (A) Percentage control diameter of isolated arterioles exposed to increments in intraluminal pressure (time control-no drug treatment). (B) Slope before and after step increments in pressure for the two separate control series (n = 5). Data are presented as mean ± SEM.

