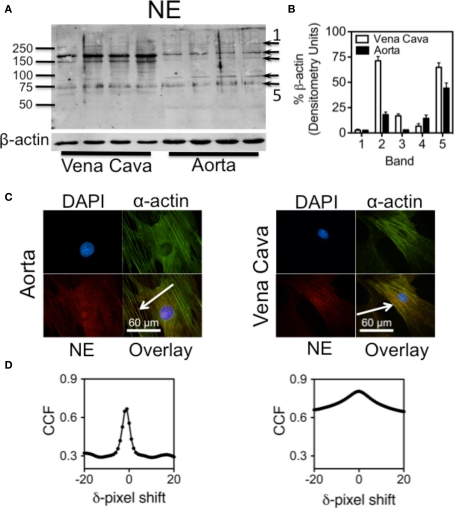
Figure 3.
Proteins amidated by endogenous NE. (A) Western analysis showing proteins recognized by an anti-NE-BSA antibody in rat aorta and vena cava homogenates not exposed to exogenous NE. (B) Densitometry of the five darkest bands, (arrows in A) from the Western analysis. Each band was normalized to β-actin. (C) Images of cultured smooth muscle cells from rat aorta (left) and vena cava (right). Cells were stained for nuclei (DAPI, blue, top left), α-actin (green, top right) and NE (red. bottom left). Overlay of the three images is bottom right. Colocalization is indicated by the yellow color. Arrows point to areas of colocalization. Images are representative of cells cultured from four different rats. (D) Van Steensel's cross-correlation functions of α-actin and NE overlays. Peaks at or near δ = 0 indicate a colocalization event. Graphs were made using the images above them, and are representative of graphs made of images from the cells of four different rats.

