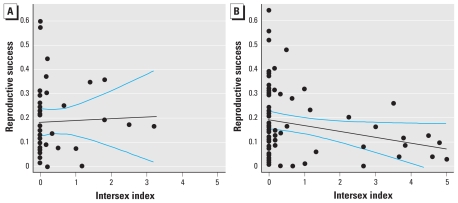
Figure 3.
The relationship between severity of intersex and reproductive success of all “male” fish in (A) study 1 and (B) study 2. In cases in which more than one fish had the same values, data points overlie each other; thus, individual data points are not always visible (this is particularly the case among the less severely intersex fish). The black lines indicate the lines of best fit, and the blue lines indicate the 95% confidence limits.

