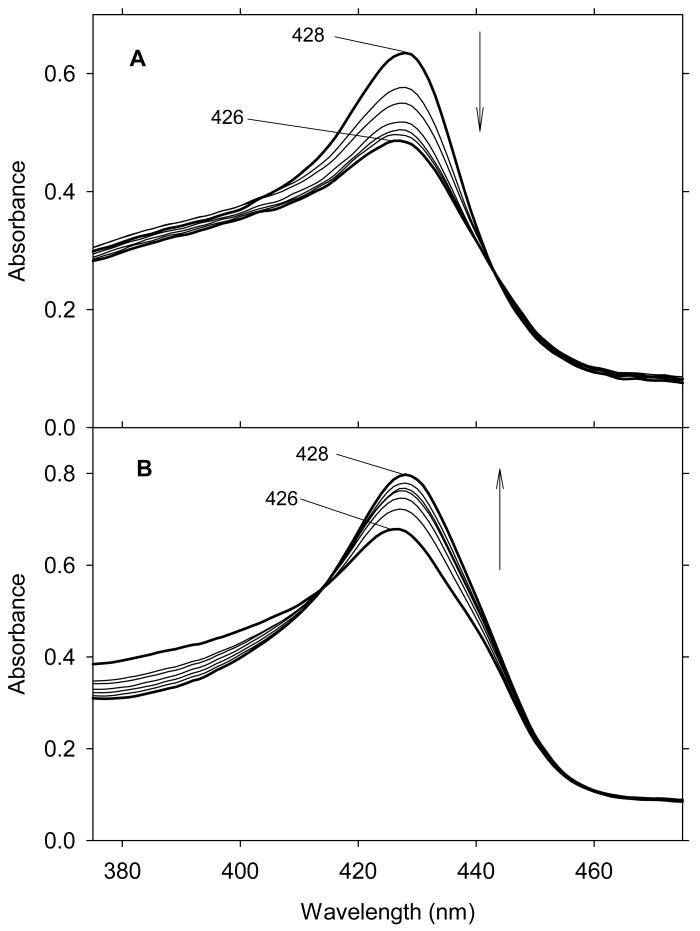
Fig. 23.
UV-Vis spectral changes upon titration of ferrous H93G Mb with tetrahydrothiophene (THT) with lower concentrations (A) of THT (< 70 μM) and with higher concentrations (B) of THT (> 2 mM). Vertical arrows indicate the direction of absorbance change. The spectra were recorded in 0.1 M potassium phosphate buffer at pH 7.0 at 4 °C. Reproduced from reference [26] with permission of the copyright holders.

