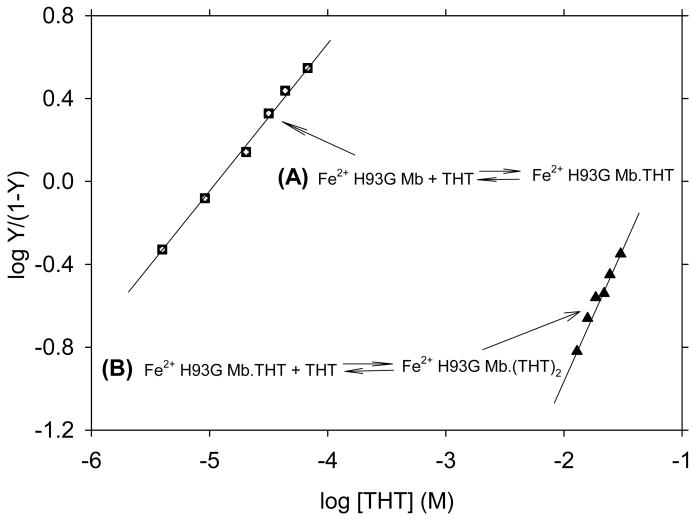
Fig. 24.
Hill plots of the titration data (absorbance change at 426 nm) shown in Fig. 23. In the Y-axis label, Y is fractional saturation of H93G Mb with THT. The Hill plots yield Kd1 = 12.6 μM (closed squares) and Kd2 = 66.0 mM (closed triangles) with slopes of 0.8 and 1.1, respectively. For additional information, see reference [26]. Reproduced from reference [26] with permission of the copyright holders.

